The overview includes a Performance Comparison table with current, previous, projected, and delta values for every metric. Side-by-side GMV and ROAS trend charts show the last seven calendar days, with country-level filtering across all your markets. A GMV by Country breakdown highlights where sales are concentrated internationally.
Beyond the overview, the platform offers dedicated modules for product-level analysis, investment planning, and catalog quality, all refreshed from operational data pipelines and powered by Gemini where AI analysis is involved.
A 360° view for advertisers: not just the past, but the decisions ahead
Booncy's AI Advertiser Dashboard goes beyond simple reporting. Built on live data from Google Ads, Merchant Center, and CPA performance feeds, it combines granular analytics with predictive forecasting and Gemini-powered feed intelligence, so you can act on insight, not just history.
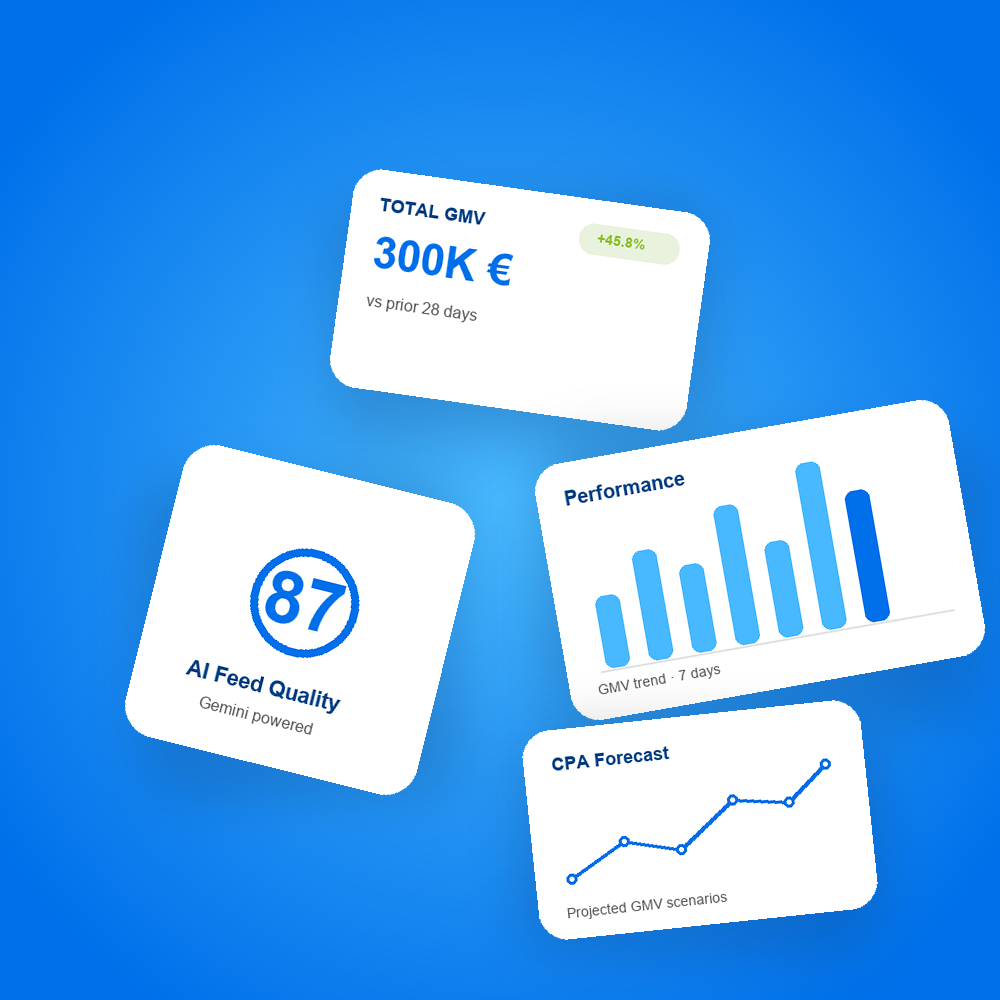
Your AI-powered control panel
Get an instant snapshot of campaign performance over the last 28 or 7 days. Compare current results against the previous period, filter by country, and track the KPIs that matter: GMV, clicks, conversions, commissions, AOV, conversion rate, and ROAS.
- Performance Comparison with 28/7-day windows, period-over-period deltas, and country filters
- CPA Change Forecast to model how target CPA adjustments affect GMV and conversions
- AI Feed Evaluation with quality scoring, strengths/weaknesses analysis, and recommendations (Gemini)
- Feed Issues dashboard for proactive detection of policy violations and catalog errors
- Google Product Category Stats and Product Cluster Performance for category- and cluster-level ROAS insight
It doesn't just analyze the past: it guides future decisions.
Top Performing Products ranks best sellers by country with clicks, sales, and conversion data. CPA Change Forecast simulates how adjustments to target CPA impact projected GMV and conversions. AI Feed Evaluation assigns a quality score with strengths, areas for improvement, and actionable recommendations. Feed Issues surfaces policy violations and technical errors before they hurt performance. AI Content Enhancement shows before/after samples of AI-optimized titles and descriptions. Google Product Category Stats delivers hierarchical category analysis (ROAS, CTR, CR), while Product Cluster Performance groups catalog items by embedding similarity and ROAS tier to reveal where to scale or optimize.
Request more information
Have questions about this resource? Fill out the form and the Booncy team will get back to you shortly.
You might also like
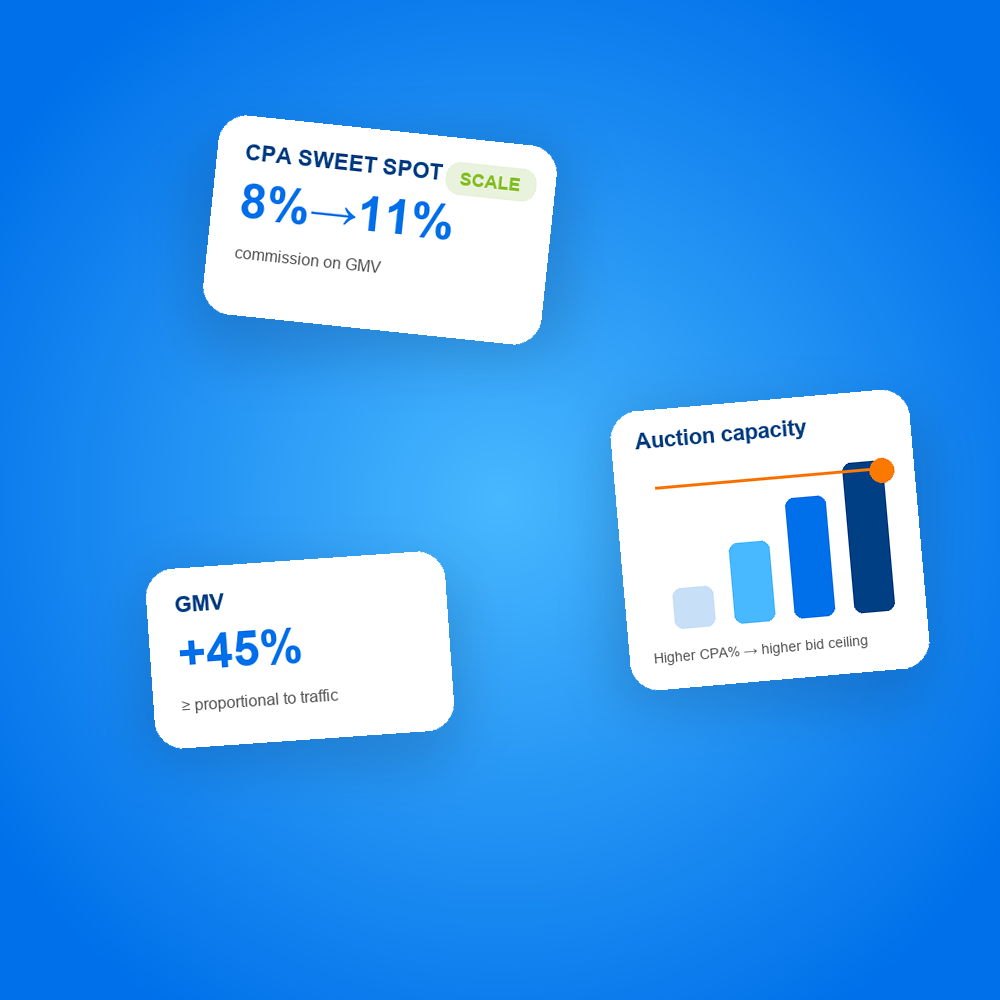
CPA uplift: how raising commission unlocks Google Shopping scale
Why a higher CPA% to your CSS is not just an acquisition cost hike: it buys auction capacity, incremental GMV and, inside the right range, higher merchant net.
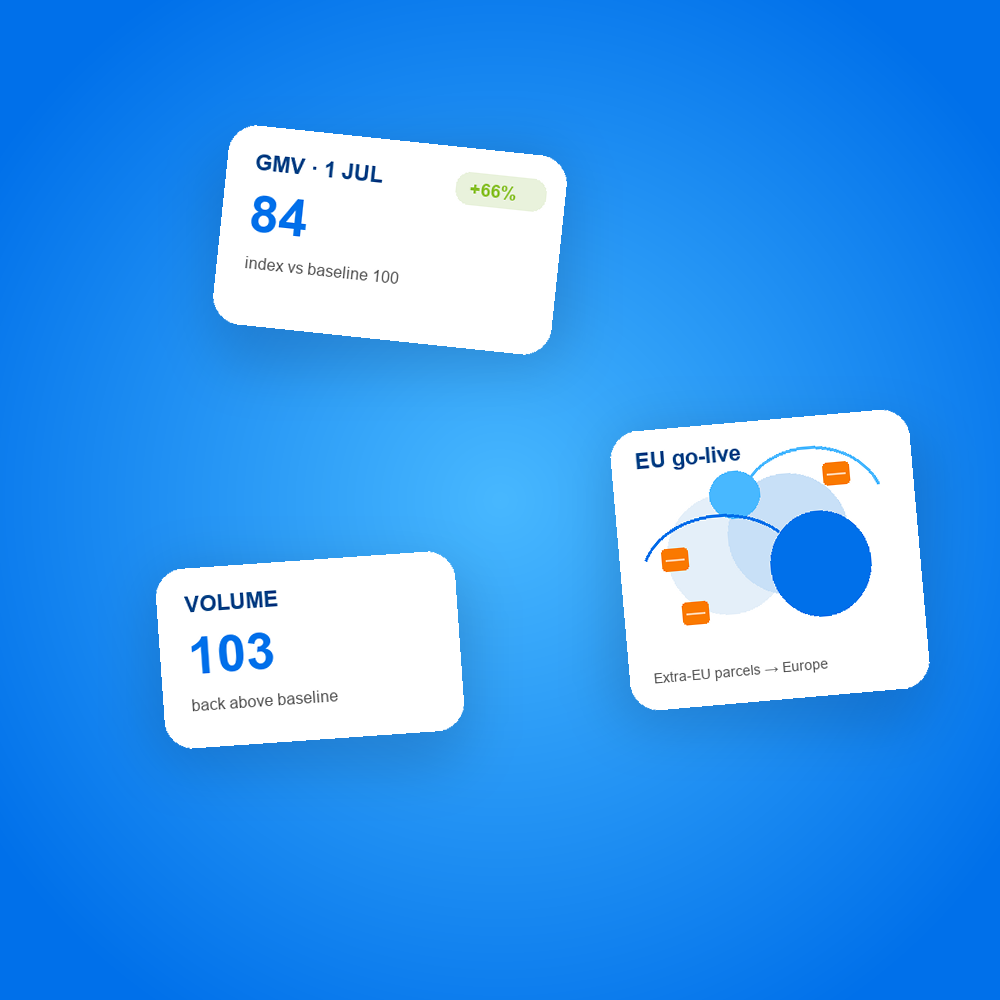
EU duties go-live: how Booncy absorbed the €3 tariff shock
What happened to Booncy Google Shopping performance in the hours before and after the EU €3 flat duty on low-value extra-EU parcels, and how hourly campaign governance turned panic into a controlled landing.
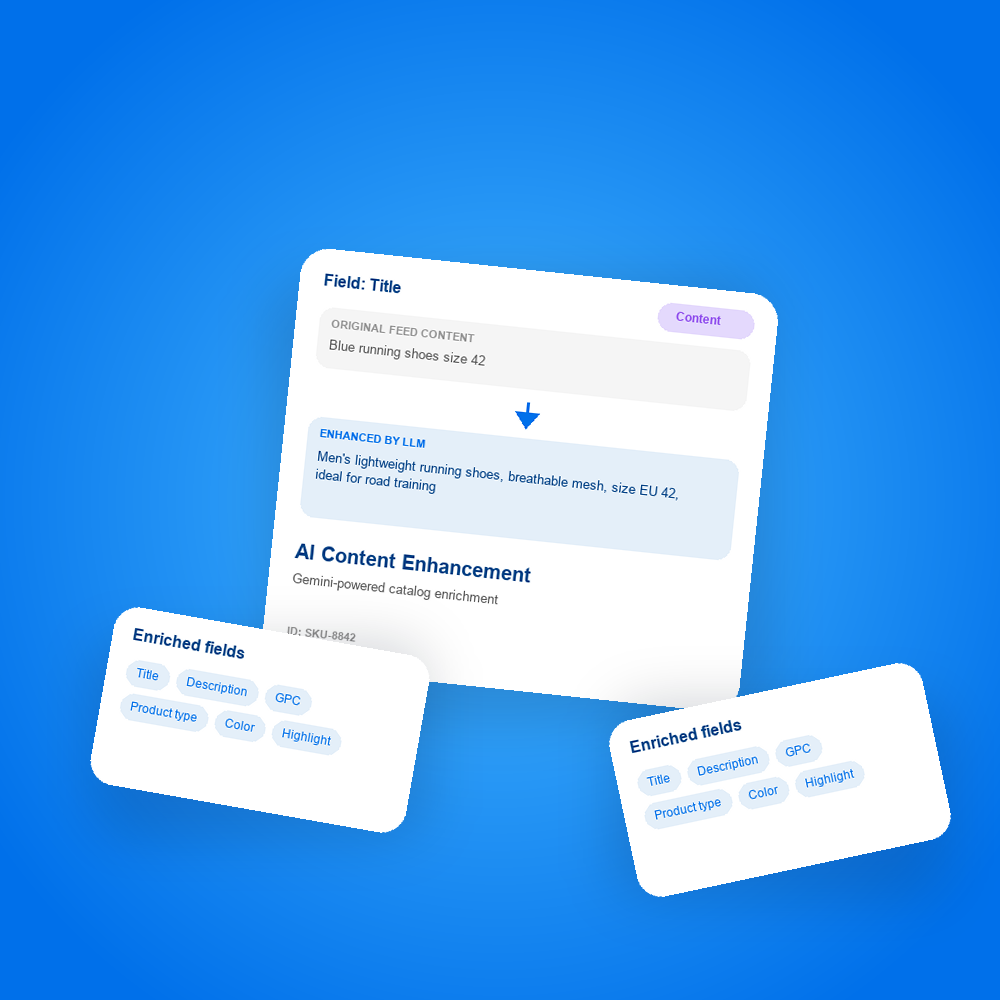
AI Feed Content Enhancement
See how Booncy uses LLMs to enrich product feeds: optimized titles, descriptions, taxonomy, and attributes, with before/after comparisons visible directly in the advertiser dashboard.

Google Ads budget & bidding changes (August 2026)
From 17 August 2026, Google Ads updates how target-based bid strategies behave on budget-limited campaigns. Understand the impact on Target CPA and Target ROAS, and how to prepare with the Bid Target Adjustment Tool.

Booncy CSS Media Kit 2026
Company overview for Booncy SRL, Google CSS Premium Partner since 2018: what we offer, how the CSS model works, network reach, case studies, and why advertisers choose us.
Want to learn more?
Contact us to discover how we can improve your store's visibility and maximize profits across your sales channels.