On 1 July 2026 the European Union introduced a flat €3 duty per item on low-value extra-EU shipments. Cross-border e-commerce expected demand to collapse. Booncy kept campaigns live, watched the portfolio hour by hour, and measured what actually changed.
Fear priced the crash before the duty existed
In the two weeks before go-live (15–30 June 2026), the market did not wait for 1 July. Anticipation arrived first, and compressed performance in advance.
Booncy runs performance campaigns on Google Shopping across Europe. On go-live day we did not pause anything. We observed, reacted, and measured, hour by hour, what really moved on our portfolio.
The normalised GMV index (baseline = 100 for 1–14 June 2026) averaged 64 in the second half of June. On 30 June, the last day before duties, it hit the trough: 50. Traffic volume was already under pressure (88 in the same window). No duty was in force yet: this was anticipation.
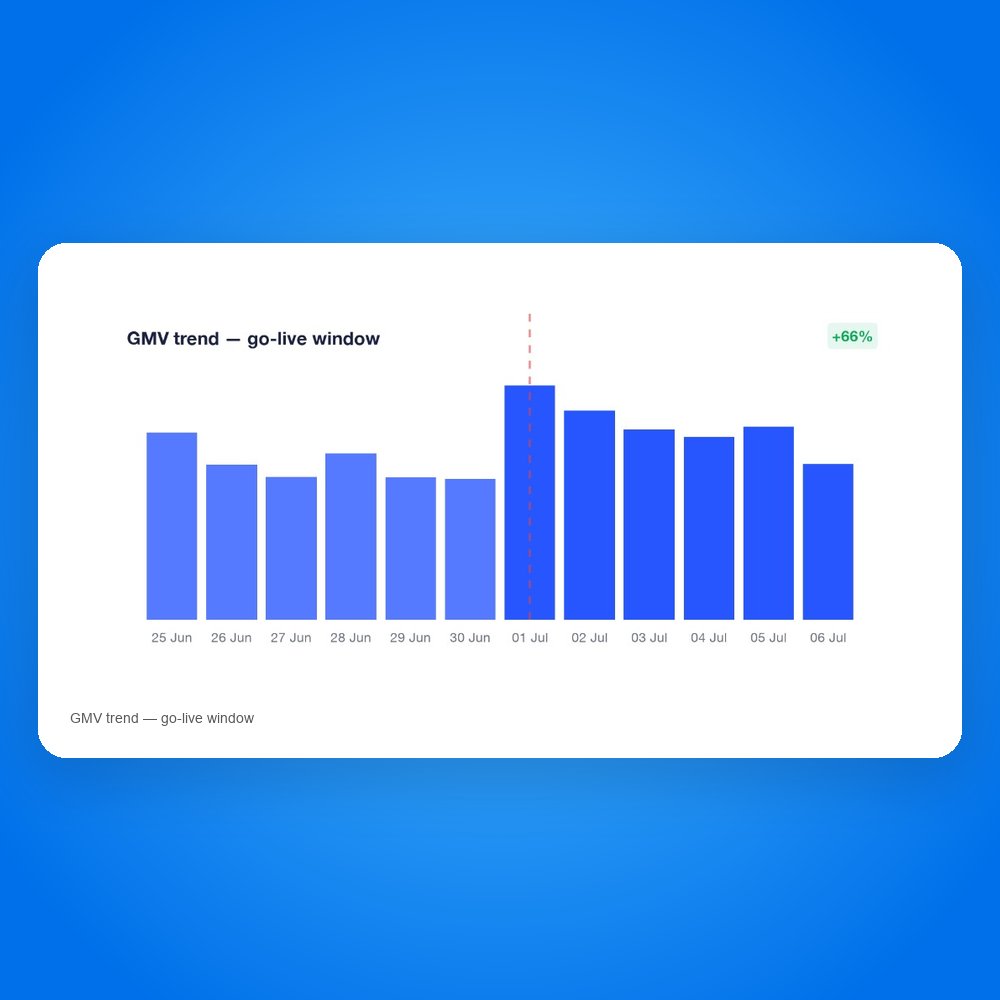
Many operators would have read that signal as “the end”. For Booncy it was the moment when hourly campaign control (seasonality adjustment and tROAS steering) had to prove its value.Normalised GMV trend across the go-live window (+66% on 1 July vs 30 June)Immediately before: 15–30 June
Three dynamics stood out in the pre-go-live anxiety window:
1. GMV compressed early. Average index 64, with a final day at 50, roughly half early-June levels. The market was already cutting exposure and purchase intent before the rule took effect.
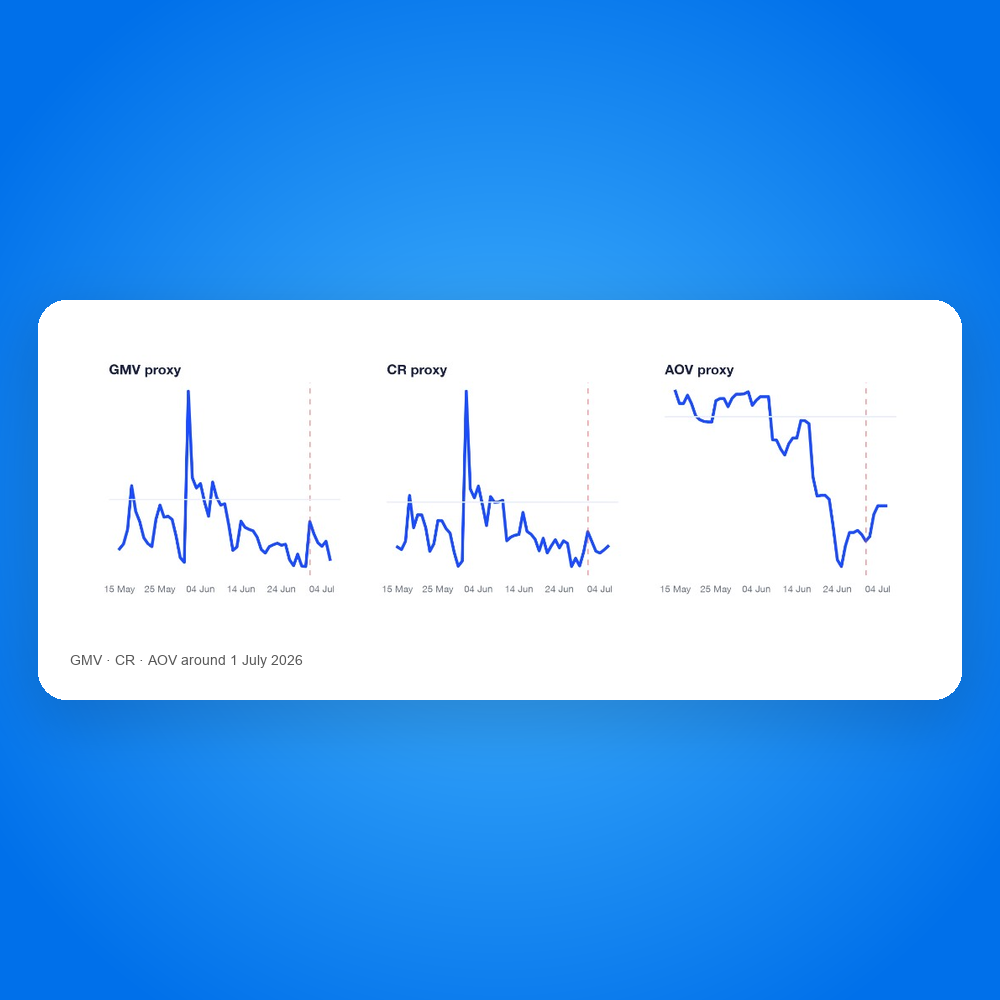
2. Conversion quality softened, but did not collapse. Average CR proxy pre-go-live: 73. Demand became more selective; it did not disappear.
3. AOV held. Cart-value proxy at 99, almost on baseline. Shoppers who still bought were not shrinking baskets. The issue was fear of buying, not average order value.
In short, Booncy was not facing a demand blackout. It was facing an anticipatory contraction driven by uncertainty.
Fear compressed GMV before 1 July: trough of 50 on 30 June (baseline 100)
Go-live day rebound: GMV +66% vs 30 June; volume back above baseline
Hourly seasonality adjustment and tROAS steering prevented autopilot damage
All metrics are normalised indices; no absolute spend or GMV disclosed
On 30 June GMV was already at a fear trough. On 1 July, duties day, we recorded a +66% rebound.
Immediately after: 1–6 July
When duties became real, the market question was simple: would 30 June’s minimum become the new normal?
No.
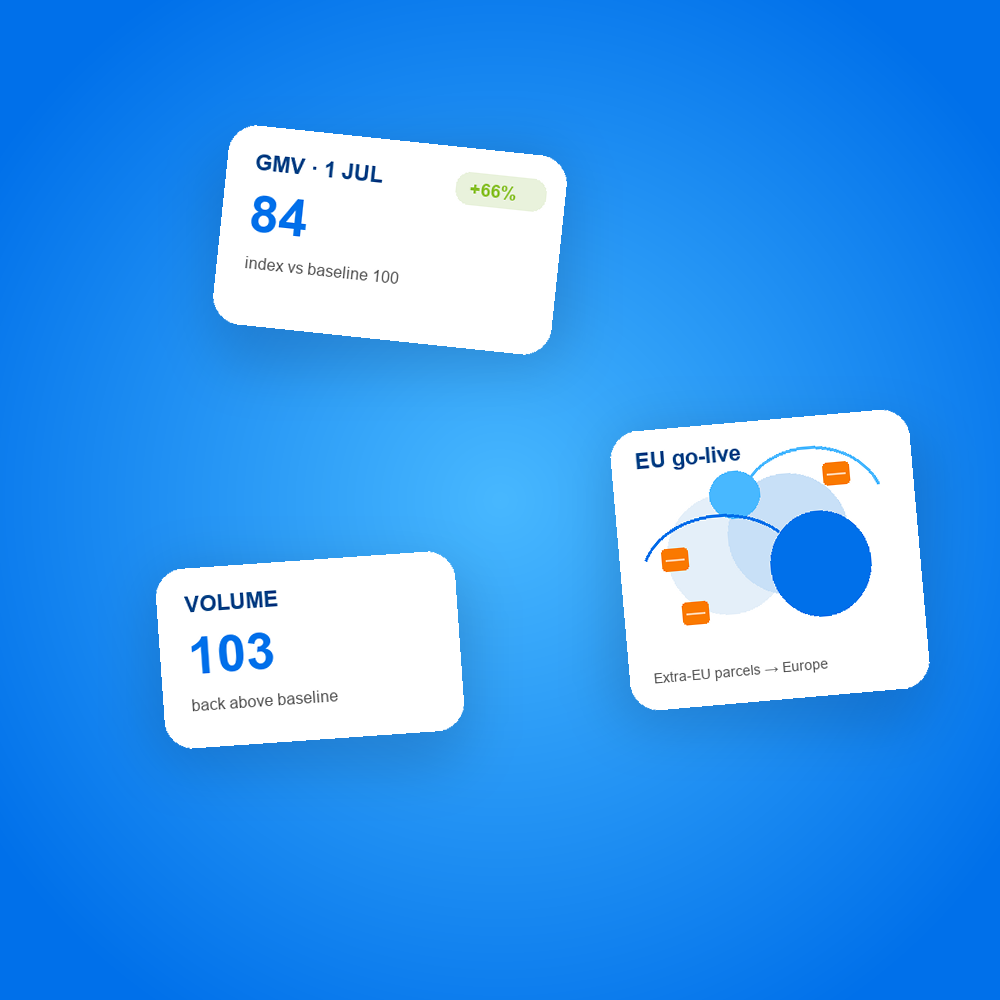
On go-live day itself, the GMV index climbed to 84, a +66% rebound versus 30 June. Volume moved back above baseline (103). The CR proxy recovered to 81. AOV stayed stable at 98.
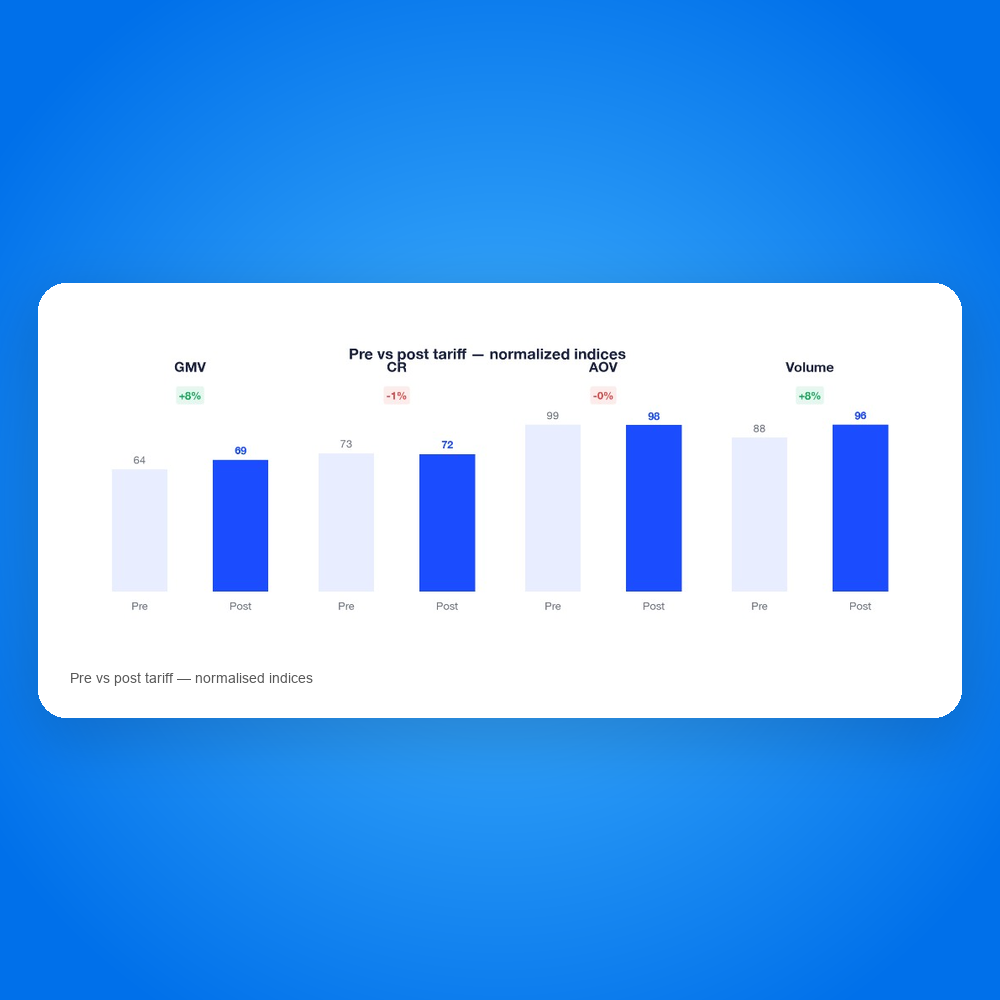
First-week post-go-live averages tell the same structural story:
GMV: 69 vs 64 pre (+8%)
Volume: 96 vs 88 (+8%)
CR: 72 vs 73 (−1%, essentially flat)
AOV: 98 vs 99 (−0%, no basket trade-down)
The “impossible problem” turned out to be a controlled landing: after pre-event anxiety, demand returned and traffic quality held.Pre vs post go-live: normalised indices for GMV, CR, AOV and VolumeThe Booncy absorption effect
Absorbing the shock does not mean pretending duties do not exist. It means stopping a panic narrative from becoming a self-fulfilling prophecy on the performance channel.
Between 30 June and 1 July we moved the GMV index by 33 points, from the fear trough (50) to the go-live rebound (84). That is not magic: it is hourly Google bidding governance (tROAS) through seasonality adjustment, feed quality, and continuous reading of yield and volume.
For an advertiser, and for anyone evaluating a performance partner, the point is this: when external policy changes, the channel cannot stay on autopilot. Booncy is built to react in hours, not quarters.GMV · CR · AOV series around 1 July 2026What this case study leaves you with
Fear hit before the duties. The GMV trough arrived on 30 June, not 1 July.
Go-live day was not a crash. GMV +66% vs the previous day; volume back above baseline.
AOV and CR did not deteriorate. Baskets held; conversion quality stayed stable pre vs post.
Absorption is operational. Not a marketing claim, but the result of measurable interventions in the hours around go-live.
All figures in this case study are normalised indices (baseline 1–14 June 2026 = 100). No absolute spend, click, or GMV values are published.
Methodology note. GMV: proxy from realised affiliate commissions. CR: commission-yield per click. AOV: ratio of realised to estimated commissions (basket stability). Pre window: 15–30 June 2026. Post window: 1–6 July 2026. Data reflects Booncy Google Shopping performance activity in Europe over the analysed period.
Request more information
Have questions about this resource? Fill out the form and the Booncy team will get back to you shortly.